
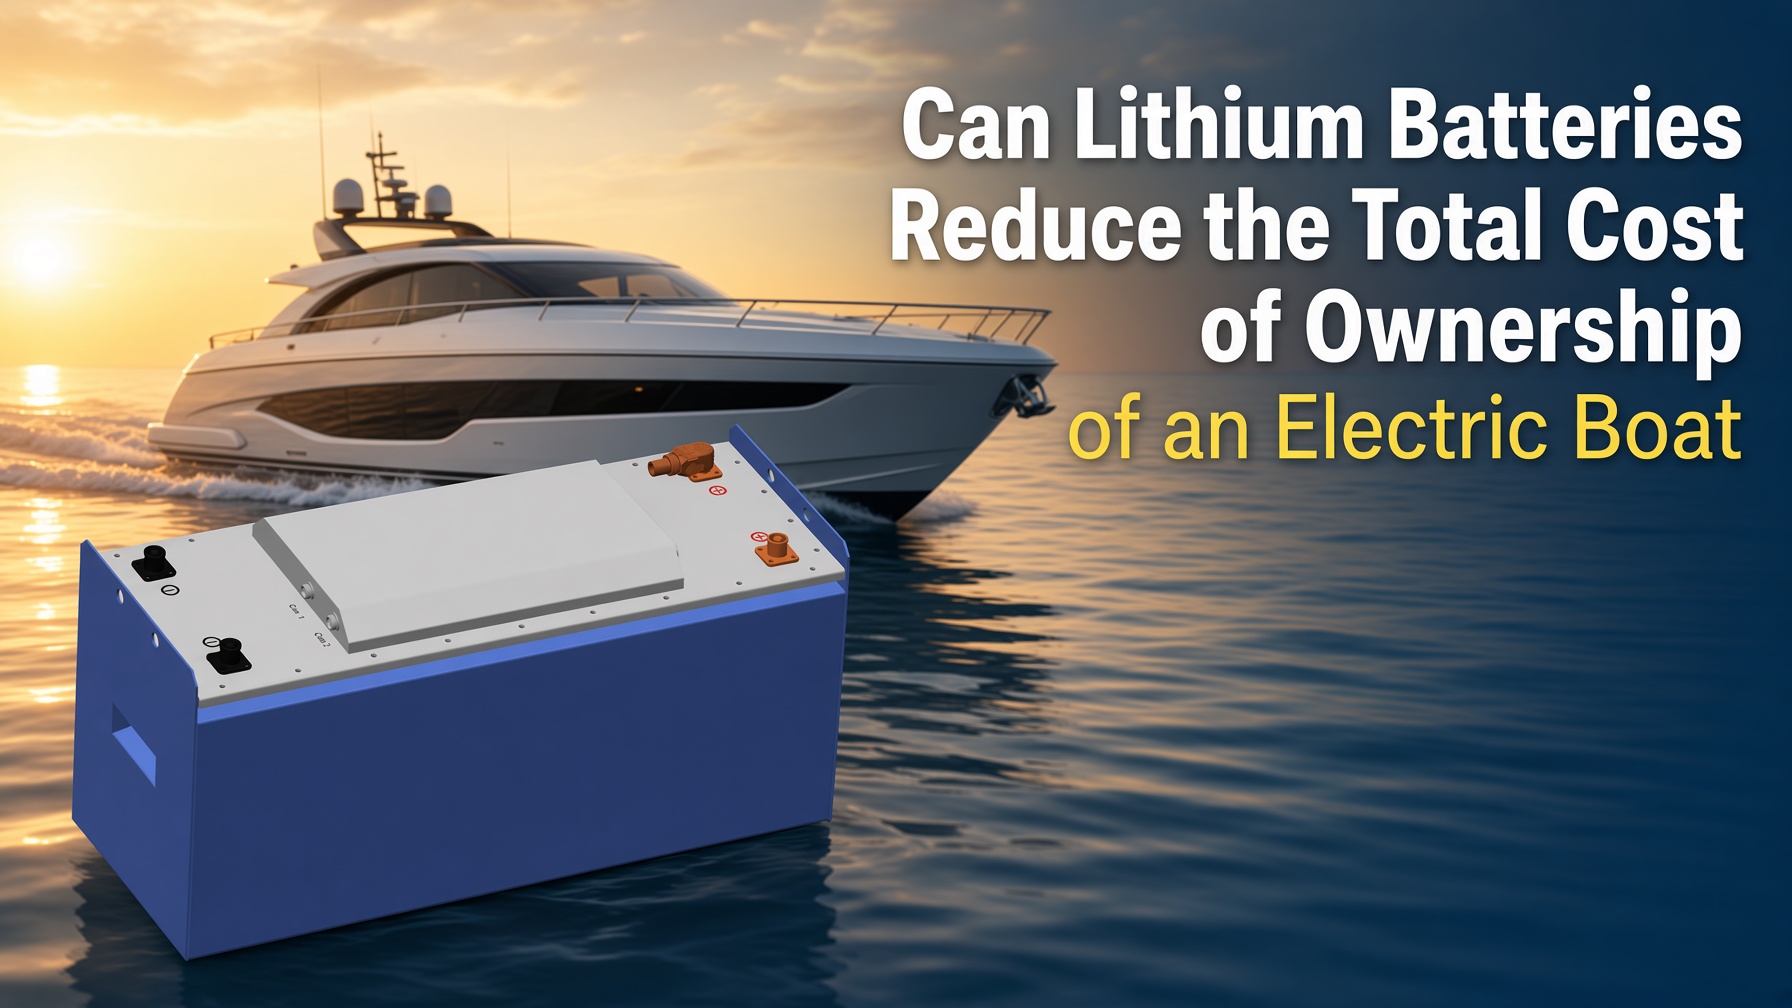
Lithium batteries, particularly lithium iron phosphate (LiFePO₄ or LFP), have shifted the economics of electric propulsion for recreational and light-commercial craft. Higher upfront cost is offset by longer cycle life, higher usable capacity, lower energy losses, reduced maintenance, and lighter weight. For owners who accumulate meaningful annual hours, the question is no longer whether lithium batteries can reduce the total cost of ownership of an electric boat—it is how quickly the crossover occurs and how large the lifetime advantage becomes.
This briefing examines the cost drivers, quantifies typical 5- and 10-year outcomes, and supplies decision criteria for builders, fleet operators, and private owners evaluating lithium systems in 2026.

Key Cost Drivers in Electric-Boat TCO
Total cost of ownership for an electric boat comprises:
- Battery capital cost and replacement
- Energy (electricity) cost
- Maintenance and downtime
- Weight-related efficiency effects
- Residual value and second-life potential
- Compliance and safety certification
Lead-acid (flooded or AGM) systems remain cheaper at purchase but lose on every subsequent line item. LFP systems reverse the ranking once cycle count and energy throughput are properly accounted for.
Cycle Life and Replacement Frequency
Quality marine LFP packs routinely deliver ≥3,500–5,000 cycles at 80 % depth of discharge (DoD). Torqeedo’s Deep Blue Battery 80 is rated at ≥3,750 cycles at 80 % DoD (or 4,000 cycles at 75 % DoD) and carries a 10-year capacity warranty. In contrast, deep-cycle lead-acid banks typically manage 300–600 cycles at 50 % DoD before capacity falls below usable thresholds.
A boat accumulating 150–200 equivalent full cycles per year will exhaust a lead-acid bank in 2–4 years and an LFP bank in 15–25+ years. Over a 10-year horizon the lithium system often requires zero or one partial replacement; the lead-acid system requires two to four complete replacements.
Usable Capacity and Round-Trip Efficiency
LFP supports 80–100 % DoD with minimal degradation, while lead-acid is normally limited to 50 % to preserve life. Combined with 95–98 % round-trip efficiency versus 70–85 % for lead-acid, the effective energy delivered per nameplate kilowatt-hour is substantially higher for lithium. Opportunity charging (15–40 % of capacity during short stops) further improves utilisation without accelerating wear when state-of-charge (SOC) is kept above 20–30 %.
Weight, Range, and Hull Efficiency
LFP packs weigh roughly one-third to one-half of equivalent lead-acid capacity. On planing or foiling craft the reduction improves acceleration, top speed, and range. Candela’s C-8 demonstrates the effect: a 69 kWh lithium pack yields 57 NM at 22 kn because the light carbon-fibre platform and hydrofoils minimise drag. The same energy in a heavier lead-acid installation would deliver materially less distance.
Maintenance and Operational Simplicity
Lithium systems require no watering, equalisation, or frequent specific-gravity checks. Integrated battery-management systems (BMS) handle cell balancing, thermal protection, and fault isolation. Lead-acid systems demand regular inspection and electrolyte management, adding labour cost and downtime risk.
Quantitative Comparison: 10-Year Ownership Example
The following table illustrates a representative mid-size day-cruiser or light-commercial launch operating ~150–200 cycles per year. Figures are indicative 2026 market ranges and exclude the boat hull itself.
| Cost Element | Lead-Acid (AGM) | Lithium (LFP) | Noter |
|---|---|---|---|
| Initial battery bank | $1,500–$3,000 | $4,000–$9,000 | Higher capacity LFP packs for equivalent usable energy |
| Replacements over 10 years | 2–3 full sets | 0–1 partial | Based on ≥3,500-cycle LFP vs 400–600-cycle AGM |
| Energy cost (electricity) | Higher (lower efficiency) | 15–30 % lower | 95–98 % vs ~75–85 % round-trip |
| Maintenance labour | $800–$1,500 cumulative | Near zero | Watering, corrosion, equalisation |
| Downtime / lost utilisation | Moderate | Lav | Fewer service events |
| 10-year battery + energy TCO | Higher | Lower (typically 30–50 % advantage) | Crossover often occurs in years 3–6 |
For high-utilisation vessels (charter, ferry, workboat) the payback compresses to 2–4 years. For low-hour private boats the advantage is smaller but still positive once residual value and weight benefits are included.
Standards and Safety as Cost Controls
Compliance reduces long-term risk and insurance cost. Relevant 2025–2026 standards include:
- ISO 23625:2025 – Small craft — Lithium-ion batteries (selection, installation, safety information; references IEC 62619 and IEC 62620)
- ABYC E-13 (2025 revision) – Lithium-ion batteries (BMS requirements, installation, system design for systems >500 Wh)
- IEC 62619 / UL 2580 or equivalent for industrial/marine cell and pack safety
Systems that meet these standards and incorporate robust BMS thermal and electrical protection minimise the probability of costly incidents and support higher residual values.
Decision Framework: When Lithium Lowers TCO
Evaluate the following criteria in order:
- Annual energy throughput – >100–150 equivalent full cycles strongly favours LFP.
- Required usable capacity and weight budget – Space- or weight-constrained platforms gain immediate efficiency.
- Opportunity-charging availability – Frequent short top-ups (15–40 %) are well tolerated by LFP when SOC remains above 20–30 %.
- Service access and labour cost – Remote or labour-expensive locations amplify the maintenance advantage.
- Certification and warranty – Prefer packs with documented ≥3,500-cycle ratings at 80 % DoD, ISO 23625 / ABYC E-13 alignment, and multi-year capacity warranties (e.g., Torqeedo 10-year).
- Second-life and residual value – LFP packs retain usable capacity for stationary storage after marine service.
If three or more of these factors apply, lithium batteries can reduce the total cost of ownership of an electric boat by a clear margin within the first ownership cycle.
Practical Checklist for Buyers and Builders
- Confirm pack chemistry is LiFePO₄ and cycle life is stated at ≥80 % DoD.
- Verify BMS includes cell-level monitoring, over-charge/over-discharge, and thermal cut-off with audible/visual warning.
- Size capacity for 15–40 % opportunity charging headroom while keeping daily discharge above 20–30 % SOC.
- Require ISO 23625:2025 or ABYC E-13 compliant installation documentation.
- Model 10-year cash flow including replacement, energy, and labour under realistic annual hours.
- Evaluate weight impact on range and payload for the specific hull.
- Check residual-value assumptions and second-life pathways.
Ofte stillede spørgsmål
How many cycles can a marine LFP battery realistically deliver? Premium packs such as the Torqeedo Deep Blue Battery 80 are rated ≥3,750 cycles at 80 % DoD or 4,000 cycles at 75 % DoD under controlled conditions. Field life of 3,500–5,000 cycles is commonly achieved when temperature and SOC limits are respected.
Does the higher purchase price of lithium ever pay back on a low-use private boat? Yes, but the horizon lengthens. Even at 50–80 cycles per year the elimination of two or three lead-acid replacements plus efficiency and weight gains usually produces a net positive within 8–12 years, excluding lifestyle and residual-value benefits.
What role does opportunity charging play in TCO? Short top-ups of 15–40 % capacity during the day keep the average SOC higher, reduce deep-cycle stress, and extend calendar life. LFP tolerates this pattern far better than lead-acid.
Are there regulatory requirements that affect cost? Yes. Systems above 500 Wh must satisfy ISO 23625:2025 and, in North America, ABYC E-13. Non-compliant installations can increase insurance premiums or create liability exposure that erodes any nominal savings.
How does the Candela C-8 illustrate the TCO case? Its 69 kWh lithium pack delivers 57 NM at 22 kn because low mass and foil efficiency multiply the value of every stored kilowatt-hour. A heavier lead-acid equivalent would require more energy (and more cost) for the same mission.
Konklusion
When annual utilisation, weight sensitivity, and service economics are considered together, lithium batteries—especially LFP chemistry meeting current marine standards—reduce the total cost of ownership of an electric boat for the majority of commercial and many private applications. The crossover point has moved earlier with declining pack prices and improving cycle warranties. Owners and builders who model throughput, opportunity charging, and residual value accurately will find the economic case increasingly compelling in 2026 and beyond.
Authoritative References
- ISO 23625:2025 – Small craft — Lithium-ion batteries: https://www.iso.org/standard/85220.html
- ABYC E-13 Lithium Ion Batteries (2025 revision): https://webstore.ansi.org/standards/abyc/abyc132025
- Torqeedo Deep Blue Battery 80 technical data: https://www.torqeedo.com/us/en-us/green-propulsion/battery-technology-com.html
- Candela C-8 specifications: https://candela.com/leisure-boats/candela-c-8/
- IEC 62619 – Secondary cells and batteries containing alkaline or other non-acid electrolytes – Safety requirements for secondary lithium cells and batteries for use in industrial applications
- Marine Power Lab LiFePO4 vs Lead-Acid 10-year comparison: https://marinepowerlab.com/lifepo4-vs-lead-acid-10-year-total-cost-ownership/
- Volta Yachts Electric vs Diesel/Gas 10-year cost analysis: https://www.voltayachts.com/en/magazine/electric-vs-diesel-boats-cost-comparison-2025